Choose a country or area to see content specific to your location
Choose a country or area to see content specific to your location
Posters
Bode Plots
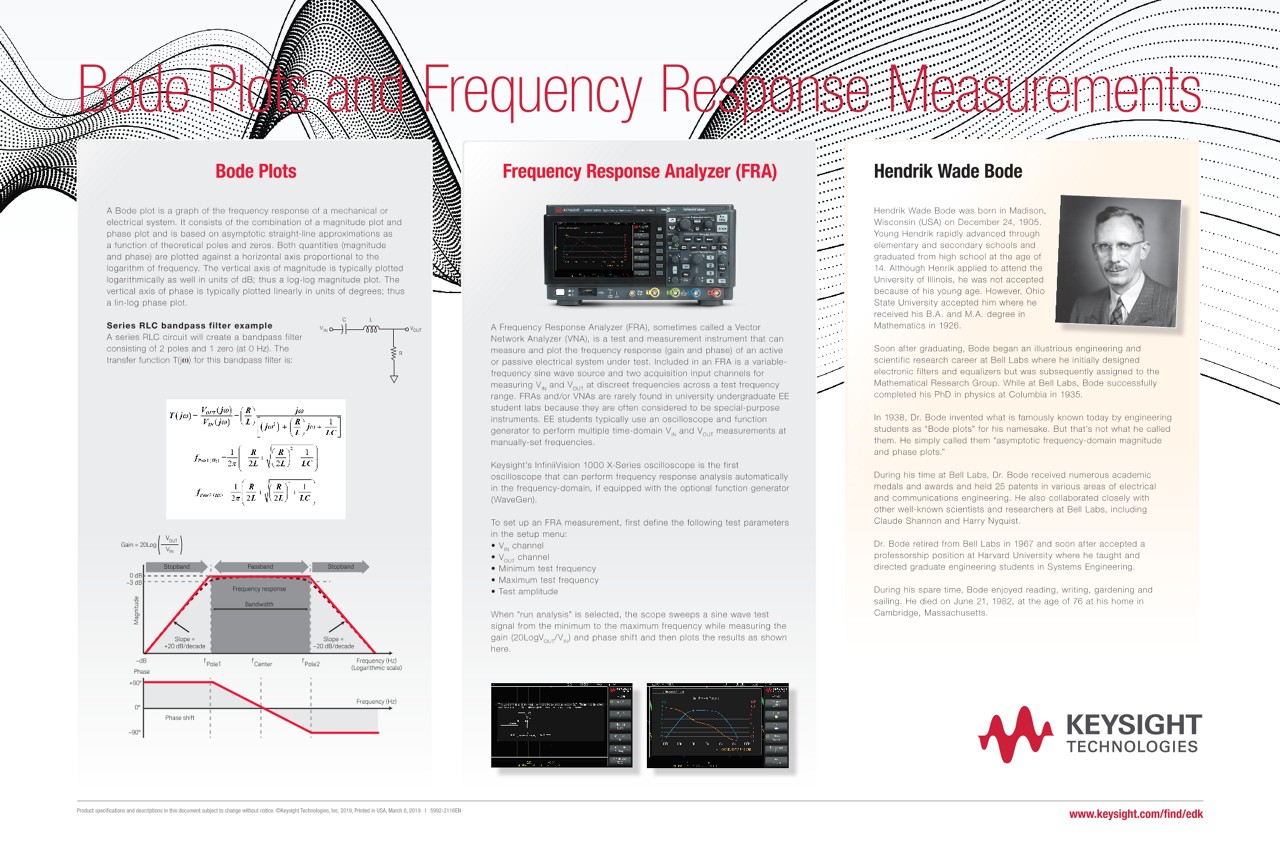
A Bode plot is a graph of the frequency response of a mechanical or electrical system. It consists of the combination of a magnitude plot and phase plot and is based on asymptotic straight-line approximations as a function of theoretical poles and zeros. Both quantities (magnitude and phase) are plotted against a horizontal axis proportional to the logarithm of frequency. The vertical axis of magnitude is typically plotted logarithmically as well in units of dB; thus a log-log magnitude plot. The vertical axis of phase is typically plotted linearly in units of degrees; thus a lin-log phase plot.
解锁内容
免费注册
*Indicates required field
感谢您!
您的表格已成功提交
Note: Clearing your browser cache will reset your access. To regain access to the content, simply sign up again.
×
请销售人员联系我。
*Indicates required field
感谢您!
A sales representative will contact you soon.

