
Getting Started - Chapter 1
技术概述
Chapter 1
Getting Started
PathWave Advanced Design System (ADS)
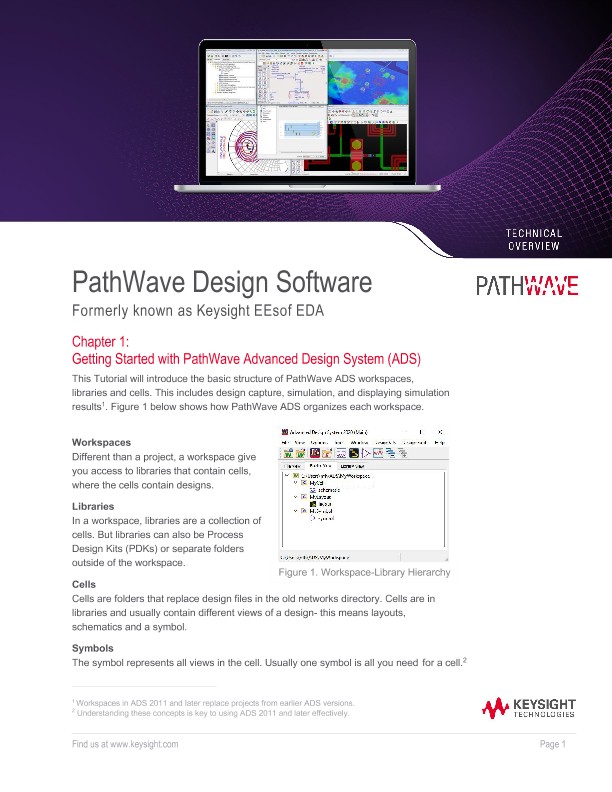
This tutorial will introduce the basic structure of PathWave ADS workspaces, libraries, and cells. This includes design capture, simulation, and displaying simulation results 1. Figure 1 shows how PathWave ADS organizes each workspace.
Workspaces
Different than a project, a workspace give you access to libraries that contain cells, where the cells contain designs.
Libraries
In a workspace, libraries are a collection of cells. But libraries can also be Process Design Kits (PDKs) or separate folders outside of the workspace.
Cells
Cells are folders that replace design files in the old networks directory. Cells are in libraries and usually contain different views of a design - this means layouts, schematics, and a symbol.
Symbols
The symbol represents all views in the cell. Usually one symbol is all you need for a cell.
Step 1 – Create a New Workspace
- Launch PathWave ADS. In the main window select File > New > Workspace. Enter workspace name as desired in the dialog box shown in Figure 2. Please note that the workspace name and path 3 to the workspace location should not contain any spaces. If you want to make changes to your PathWave ADS libraries, click on the Change Libraries… button; the ADS Analog/RF and ADS DSP libraries are included by default. Once you are satisfied with your workspace name, path, and libraries, click Create Workspace.
2. Once you complete the setup wizard, you will see the Main window, shown in Figure 3. This is where your PathWave ADS journey begins.
Step 2 – Creating Schematic Design
Circuit design typically starts from schematic entry. To start the schematic design, select File > New > Schematic or by clicking on the Schematic icon on the main window toolbar.
1. Enter the desired cell name (e.g. DiscreteLPF). Click Create Schematic.
2. A new blank schematic will be shown
3. Using the Basic Components, draw the schematic
4. Using the SP block, or S Parameter component in the Basic Components menu, add the S_Parameters simulation object to your schematic
5. Double click the S_Parameters component, which will allow you to edit the parameters. The properties window, set the following values:
Start = 0.01 GHz
Stop = 1 GHz
Num. of Points = 101
6. Once your simulation parameters are setup, got to Simulate > Simulate, or press F7, to run the simulation.
7. Using the buttons in the Palette Menu on the left, begin adding the desired graphs to the results window. In this case, we are going to add a Smith Chart for S(1,1). After clicking on the Smith Chart button, click anywhere in the white part of the results window to place the chart.
8. A dialog box will open that will allow you to add traces to the plot. Add the S(1,1) trace by selecting S(1,1) from the left side and clicking the >>Add>> button.
9. Next, using the Text tool, add the graph title. Since each results window may contain several graphs, lists, and equations, it is a good practice to label the different objects.
10. Save the results and schematic. After close both windows