您希望搜索哪方面的内容?
Application and Network Performance Monitoring
Proactively monitor networks and apps with synthetic APM, NPM, and user experience monitoring tools
Minimize Disruptions with Synthetic Monitoring
Explore Keysight's synthetic network performance monitoring (NPM), application performance monitoring (APM), and user experience monitoring tools. Simulate real-world traffic, track response times, and assure quality experience across networks, websites, devices, and applications — so you can find issues before users do.
Explore Network and Application Performance Monitoring Software

Vision + xMetrics®: Integrate monitoring for flawlessly executed trades


Vision packet brokers run flow monitoring software from Instrumentix to bring real-time insight to traders, brokerages, and exchanges. Improve monitoring of market data, network and application latency, and transaction status to protect and analyze critical data feeds and improve compliance.
xMetrics runs inside Keysight NPBs for seamless, scalable financial network visibility and control with minimal latency and operations overhead. Affordable instrumentation and seamless integration protect investments in legacy systems while leveraging modern flow instrumentation, visualization, and analytics.
- Optimize trade execution
- Differentiate service offerings
- Boost operational efficiency
- Demonstrate compliance
- Optimize monitoring and analysis with multi-hop visibility, forensics, and rich metadata
What is Synthetic Monitoring?
Unlike real user monitoring (RUM) tools, which rely on live network and application traffic, synthetic monitoring tools generate simulated application traffic, send it across your network and applications, and measure how long it takes to reach its intended destination. Continuous testing enables network operations and application delivery teams to monitor QoE and quality of service (QoS) under various conditions — helping them pinpoint service degradations, network / application latency, or bottlenecks.
What Can You Do With Synthetic Monitoring Tools?
Prevent Network Latency and Ensure Consistent QoS
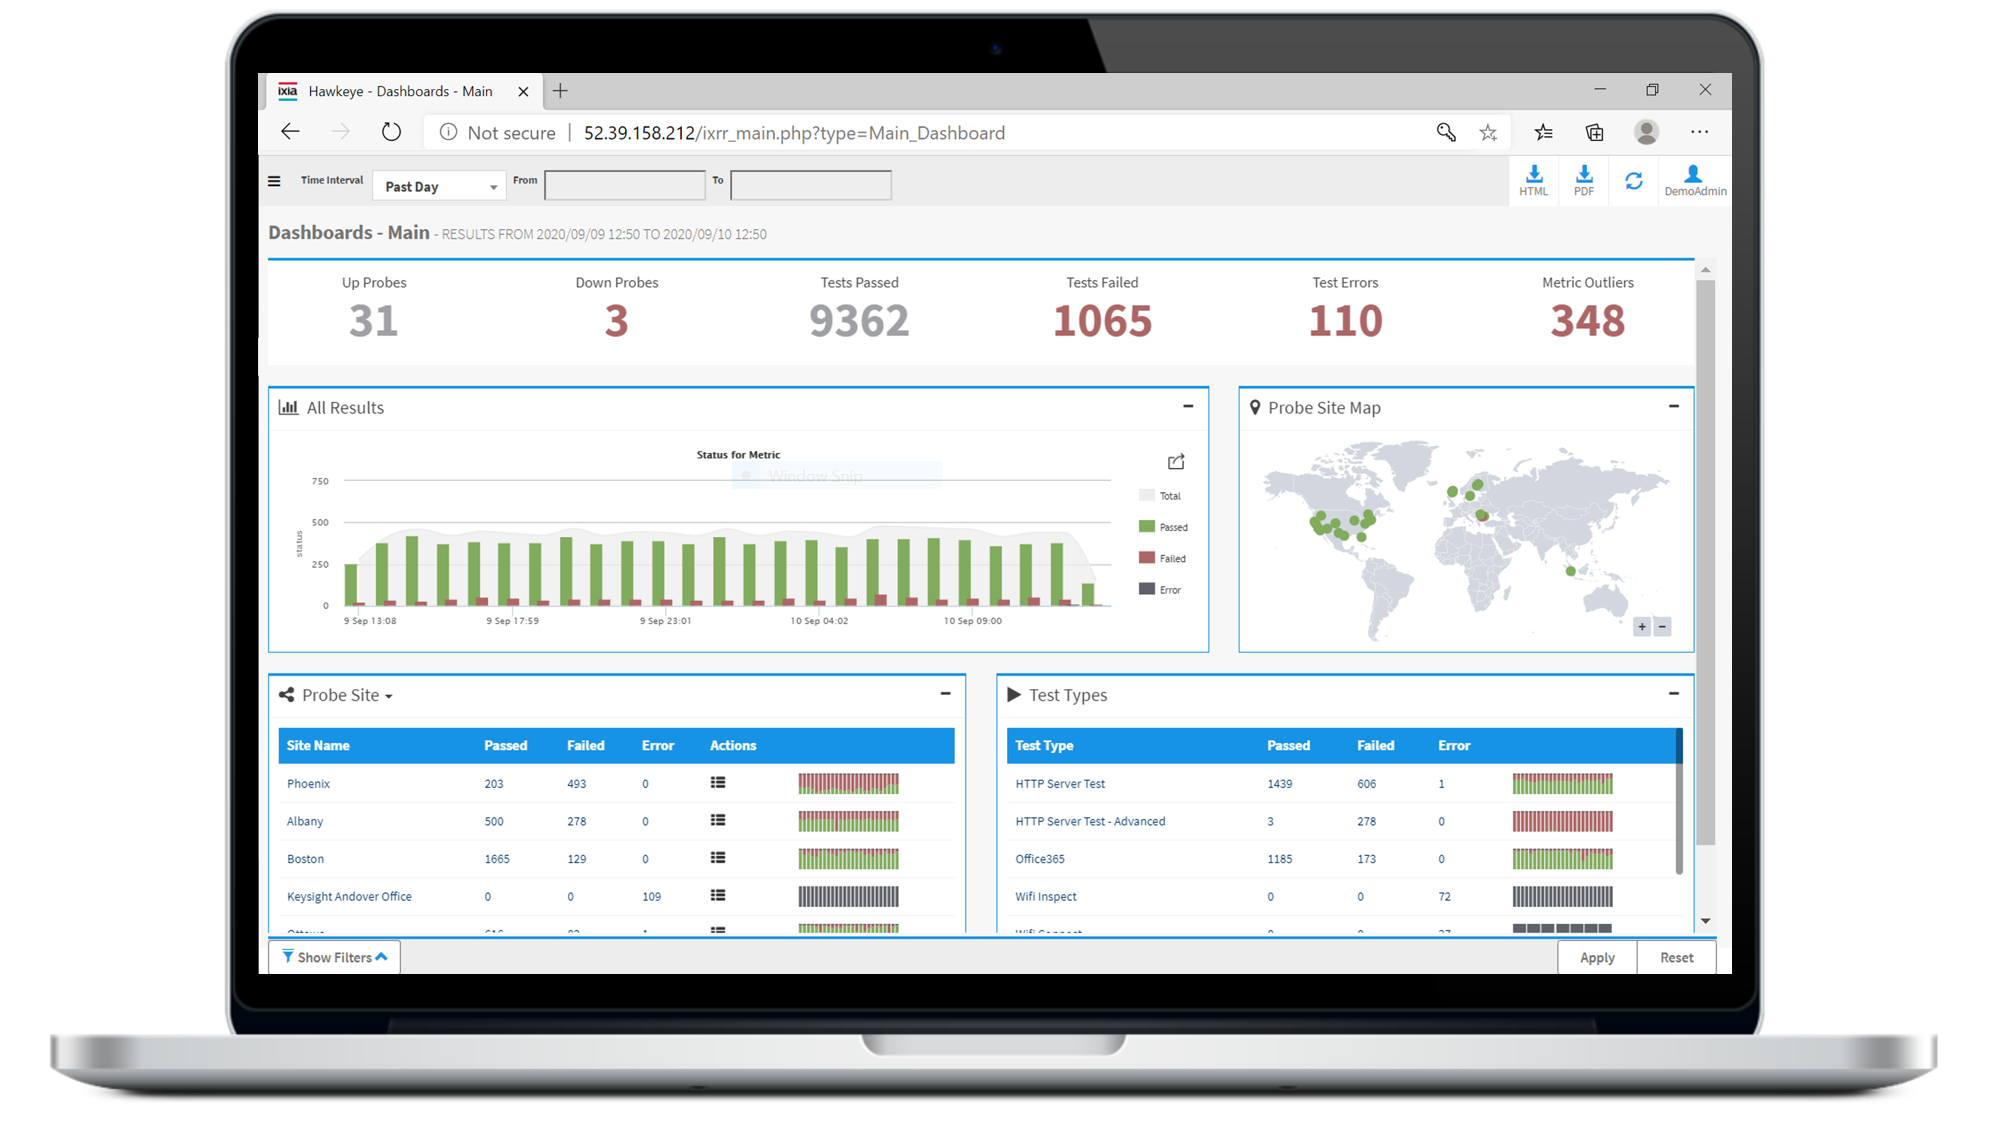
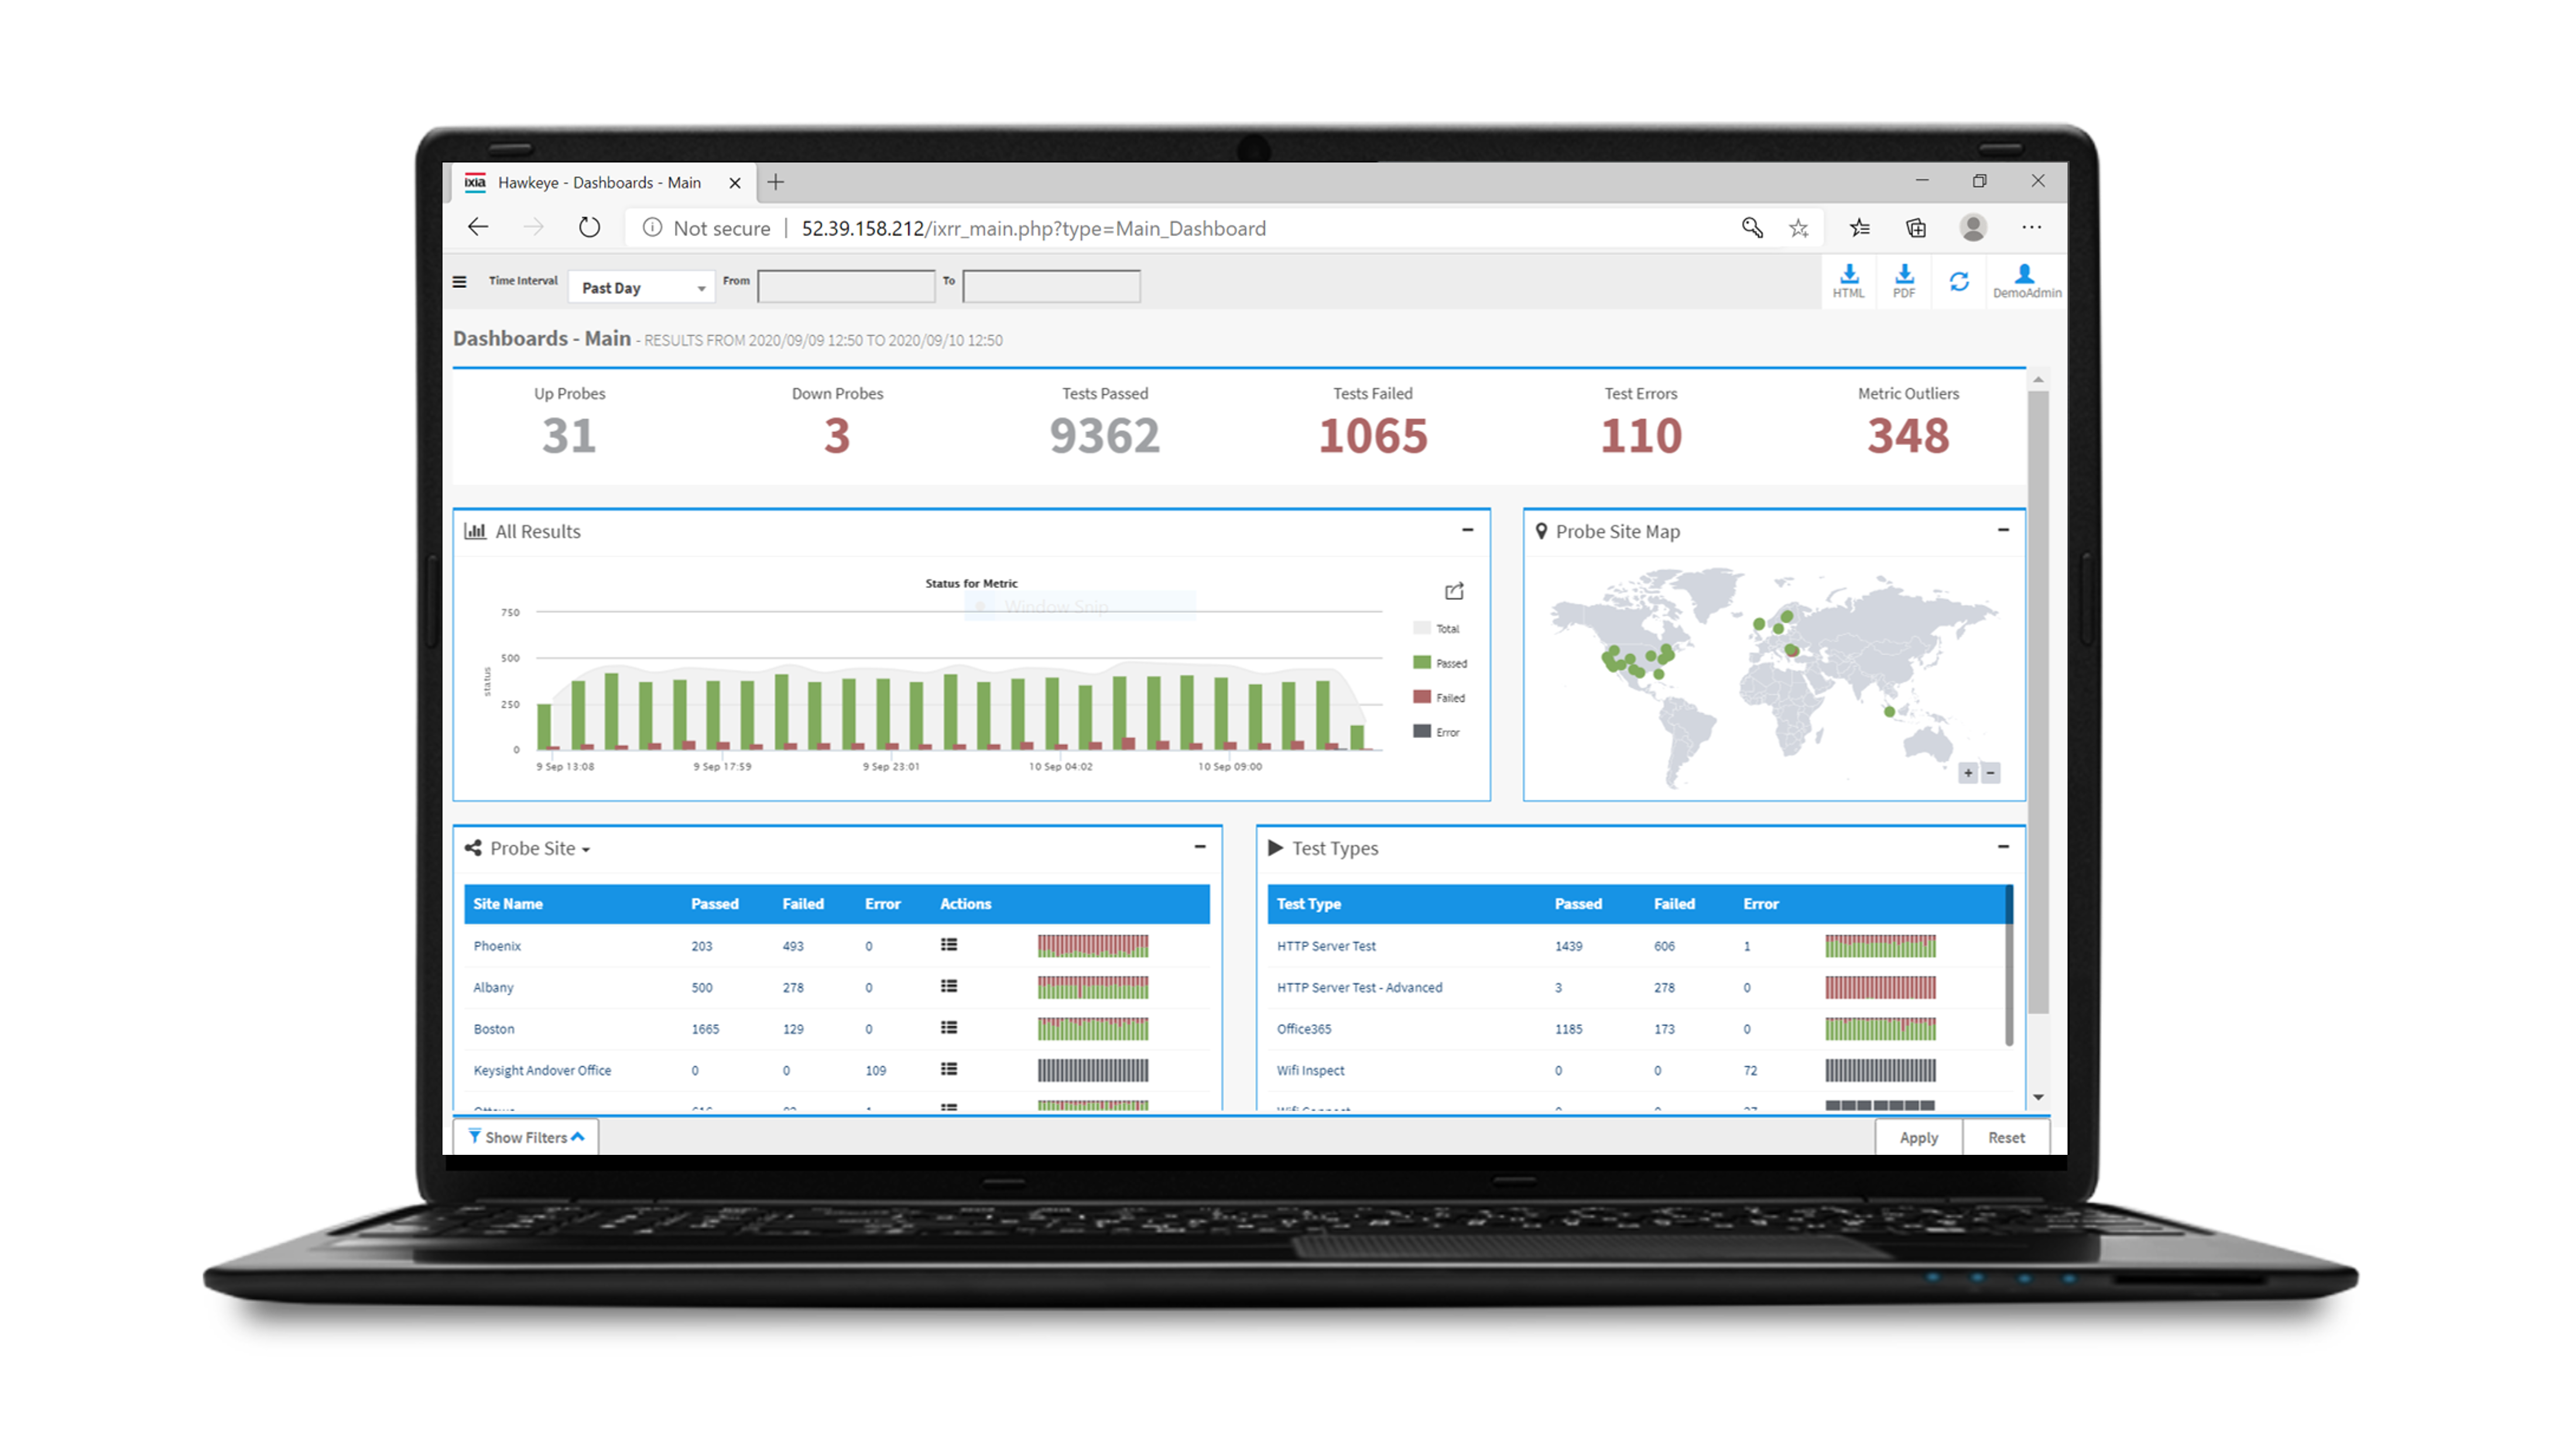
Do not let bottlenecks, latency, Wi-Fi issues, and other hard-to-pinpoint issues compromise network services (such as unified communications, VoIP, SaaS, and business applications) and performance. Hawkeye monitors network performance, isolates problems, and proactively detects issues by running scheduled verification tests by emulating a range of real-world traffic loads, interactions, and application mixes. AI-powered outlier detection and pass / fail metrics help you prioritize troubleshooting, while hop-by-hop analysis makes it easy to perform root-cause analysis and remediate problem areas.


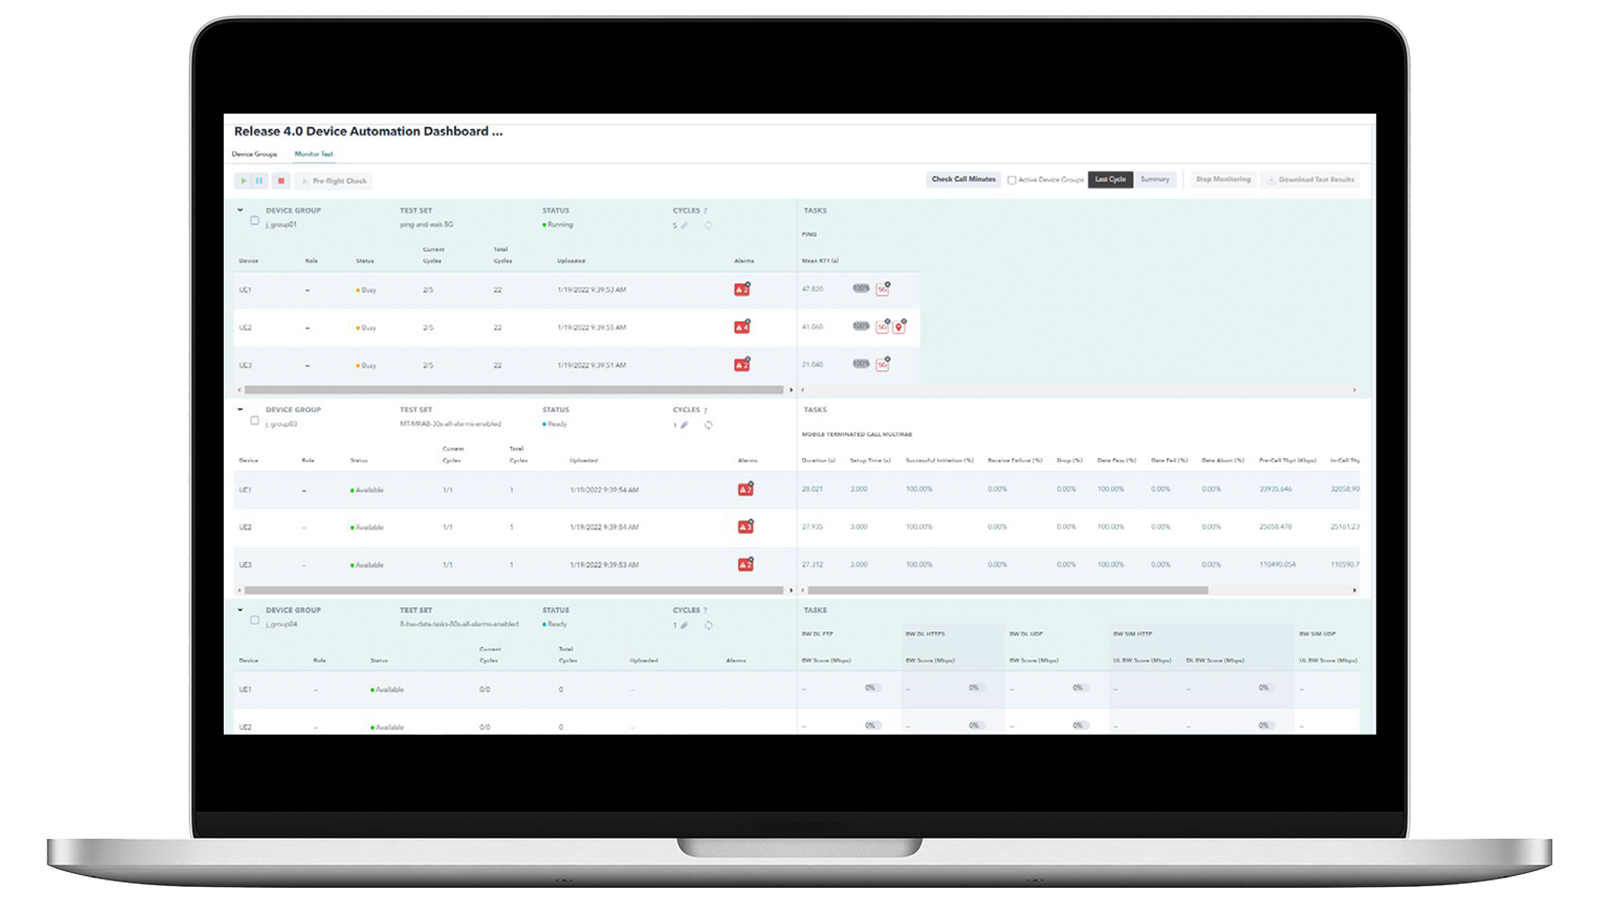
Maintain a Consistent Experience for all Mobile Users
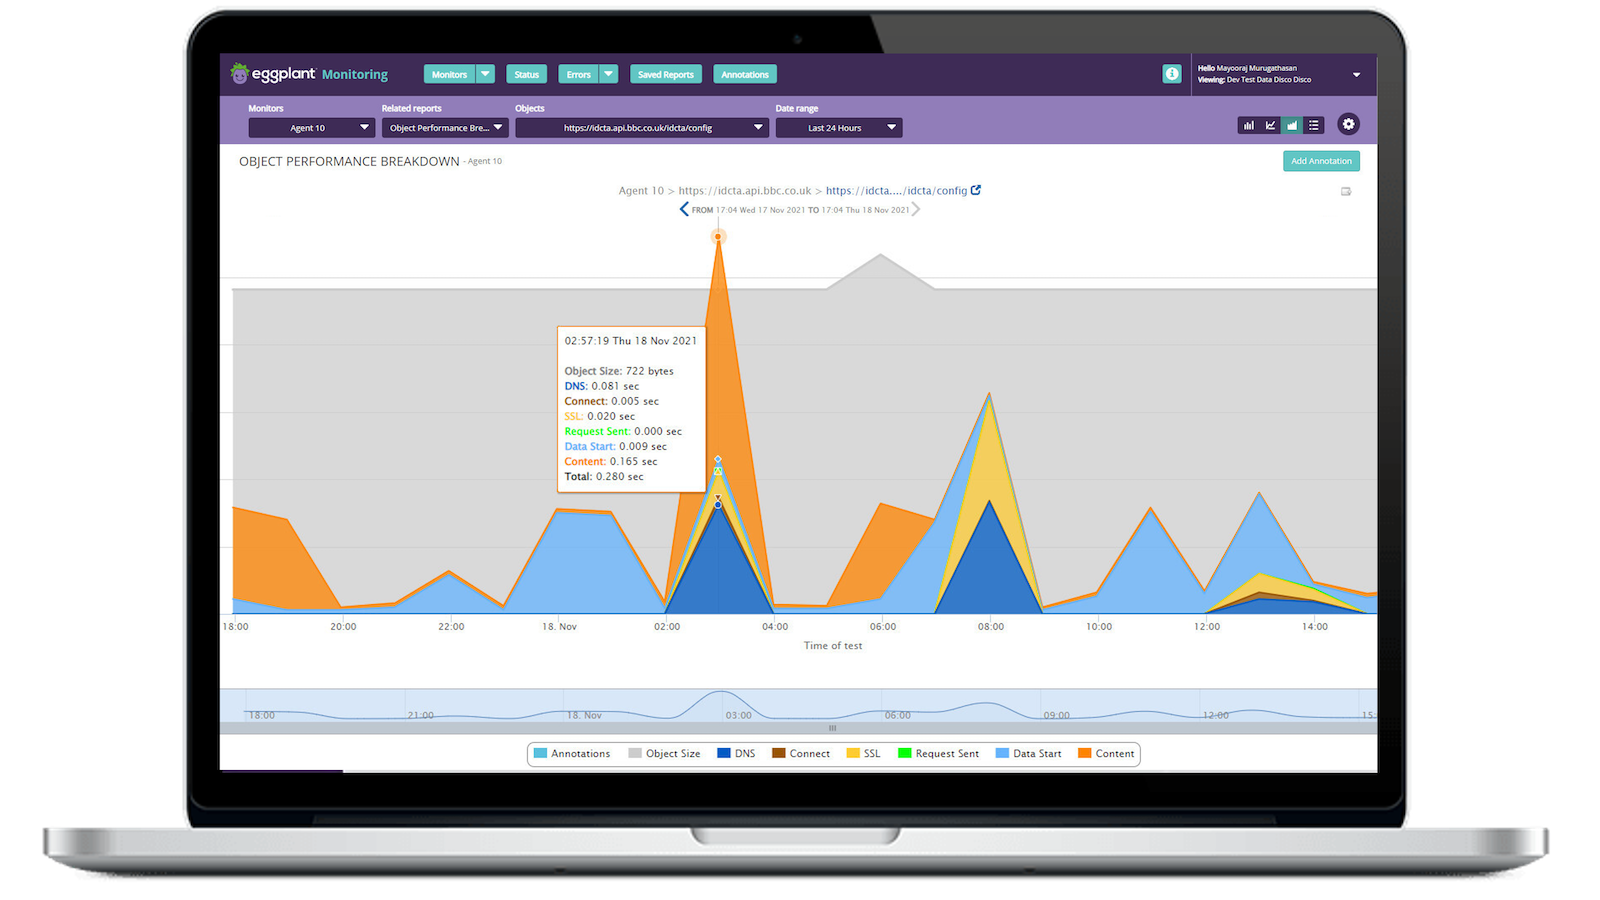
Maintaining QoS across mobile applications and websites requires more than traditional application performance monitoring. It means managing a wide range of variables — including devices, operating systems, and more. Eggplant Monitoring emulates screen resolution, upload, download, and network latency across Apple and Android environments — enabling you to ensure consistent mobile experiences and functionality across all accessible systems, websites, and applications.


Troubleshoot Faster and Optimize Service Quality From Core To Edge
Do not let complex topologies and blind spots impact your ability to maintain QoS across disaggregated hybrid networks. As key compute resources and workloads move from the cloud to the network's edge, network operations teams need synthetic NPM tools to detect performance drags and isolate their root cause. With a range of hardware- and software-based network endpoints, Hawkeye can conduct end-to-end service checks from core to edge. At the same time, node-to-node traffic visualizations accelerate troubleshooting and minimize truck rolls.


Monitor Websites and Apps From Your Users' Point of View
Minimize web-based performance drags like large JavaScript files, uncompressed images, and videos. Eggplant Monitoring emulates user behaviors and continuously tests load times, download speeds, and other UX-related performance metrics across your websites and applications. Simulate client-side factors (retry logic and variable parameterization) and back-end interactions such as API, mobile, FTP, and two-factor authentication to visualize customer journeys, pinpoint bottlenecks, and identify opportunities for optimization.


Protect Your Innovation Investment


Related uses cases
Frequently Asked Questions About Application and Network Performance Monitoring Software
Network performance monitoring (NPM) tools enable you to visualize, monitor, troubleshoot, and maximize a given network's performance, availability, and quality of service.
These tools operate one of two ways: reporting live network traffic or generating synthetic traffic and sending it across the network to various hardware- or software-based endpoints. Frequently, these tools display critical metrics and KPIs such as packet loss, jitter, delay, response time, and mean opinion score. A highly-visual, real-time dashboard utilizing AI or machine learning makes it easy for network operations teams to identify outliers and potential issues to follow up on.
Application performance monitoring (APM) tools enable IT personnel and DevOps teams to ensure enterprise and customer-facing applications meet users' expected performance, reliability, and user experience (UX) goals.
APM tools generally fall into one of two categories: real user monitoring (RUM) or synthetic monitoring. RUM platforms capture and report on traffic metrics and performance checks derived from real application users — providing real-time insights into UX and performance. Conversely, synthetic monitoring tools emulate user interactions to benchmark application performance under various conditions and scenarios — enabling operations teams to identify and remediate potential bottlenecks faster.
Traditional monitoring tools rely on actual traffic data, sometimes called passive data. Synthetic monitoring (active monitoring) tools generate simulated application traffic, inject it into your network, and capture key performance indicators. Running simulations lets you observe your network's performance under various conditions and note where performance does not meet expectations.
The process is active because you control the type and mix of applications and the traffic volume in each simulation. Since your monitoring tool is not dependent on live traffic, you can anticipate performance problems and test the impact of potential fixes. You move from being passive and reactive to being proactive.
Synthetic monitoring is excellent for assessing network readiness before deploying SD-WAN, distributed unified communications, cloud applications, or voice and video services like Microsoft Teams or Zoom. Since these tools rely on simulated traffic to measure response time, quality, or latency, you can predict performance and pinpoint bottlenecks before going live. Moreover, most industry-leading tools offer a library of application signatures — enabling you to build highly accurate tests with the exact type of traffic you expect while varying the volume to model changes in demand.
A flexible monitoring platform lets you simulate traffic from various endpoints across your distributed network, so that you can measure performance in a wide range of operating scenarios. You can test node-to-node connections in a distributed network, validate end-user experience using cloud-based applications, or ensure large-scale network deployments are ready for release.
In addition to pre-deployment and live network assessments, you can also use continuous active monitoring to proactively maintain QoS. Tracking daily simulation results makes it easy to identify deviations from the norm — giving you an early indication of when performance falls below minimum service levels.
Want help or have questions?