
Another Way to Plot Gain Compression
技术概述
PathWave System Design (SystemVue)
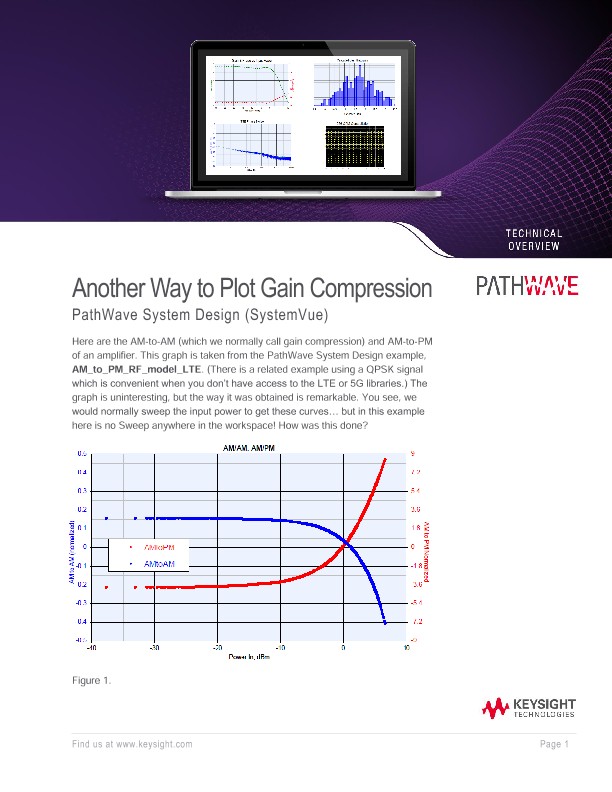
Here are the AM-to-AM (which we normally call gain compression) and AM-to-PM of an amplifier. This graph is taken from the PathWave System Design example, AM_to_PM_RF_model_LTE. (There is a related example using a QPSK signal which is convenient when you don’t have access to the LTE or 5G libraries.) The graph is uninteresting, but the way it was obtained is remarkable. You see, we would normally sweep the input power to get these curves… but in this example here is no Sweep anywhere in the workspace! How was this done?
The key is that a PathWave System Design Sink collects a time domain waveform at all points in the signal. This includes points at which the signal is at its peak, as well as where the signal is at its lowest point, and everything in between. A trajectory (I-Q) diagram clearly shows the signal crossing through zero, providing us with plenty of points to plot.
If we simply plot the magnitude of the signal at all time points, we will construct an AM-to-AM curve. This example shows an LTE signal but this works for any signal including one captured from a vector signal analyzer (VSA).
Step 1 – Capture input and output signals
In the example, two sinks Rfin and Rfout capture the signals at the input and output of the DUT.
Step 2 – MATLAB Script
The rest is done with MATLAB on the EQs_output page of the example:
• Lines 5 – 10 prepare the RFout sink for plotting. Calculation of peak and average powers, and crest factor.
• Lines 12 – 17 prepare the RFin sink in the same way.
• Line 19 calculates the nominal gain. (Or we could calculate small-signal gain if desired.)
• Line 20 creates the variable AM2AM which is then plotted to create the graph we want.
Lines 21 and 26 attach the input power as the independent (xaxis) variable for plotting. That’s all there is to it. The result of plotting AMtoAM and AMtoPM is the graph seen at the beginning of this Technical Overview.
Lastly, don’t forget that PathWave Design System has a two-channel VSA sink which, if simultaneously connected to the input and output of a DUT, can give you a live Pout vs. Pin curve. This is yet another way to measure AMto- AM and AM-to-PM, with the VSA traces looking like Figure 4:
Consider taking advantage of PathWave Design Systems’s ability to draw gain compression and phase vs. drive graphs without having to bother with a Sweep.